
Uganda · Public health
Measles-Rubella campaign monitoring
A national view of vaccination targets, coverage and reporting, with district-level performance in focus.
100% dummy/test data — demonstration only. All figures in this screenshot are synthetic. They do not represent live reporting, actual programme results or real health and education statistics.
The context
What the dashboard brings together.
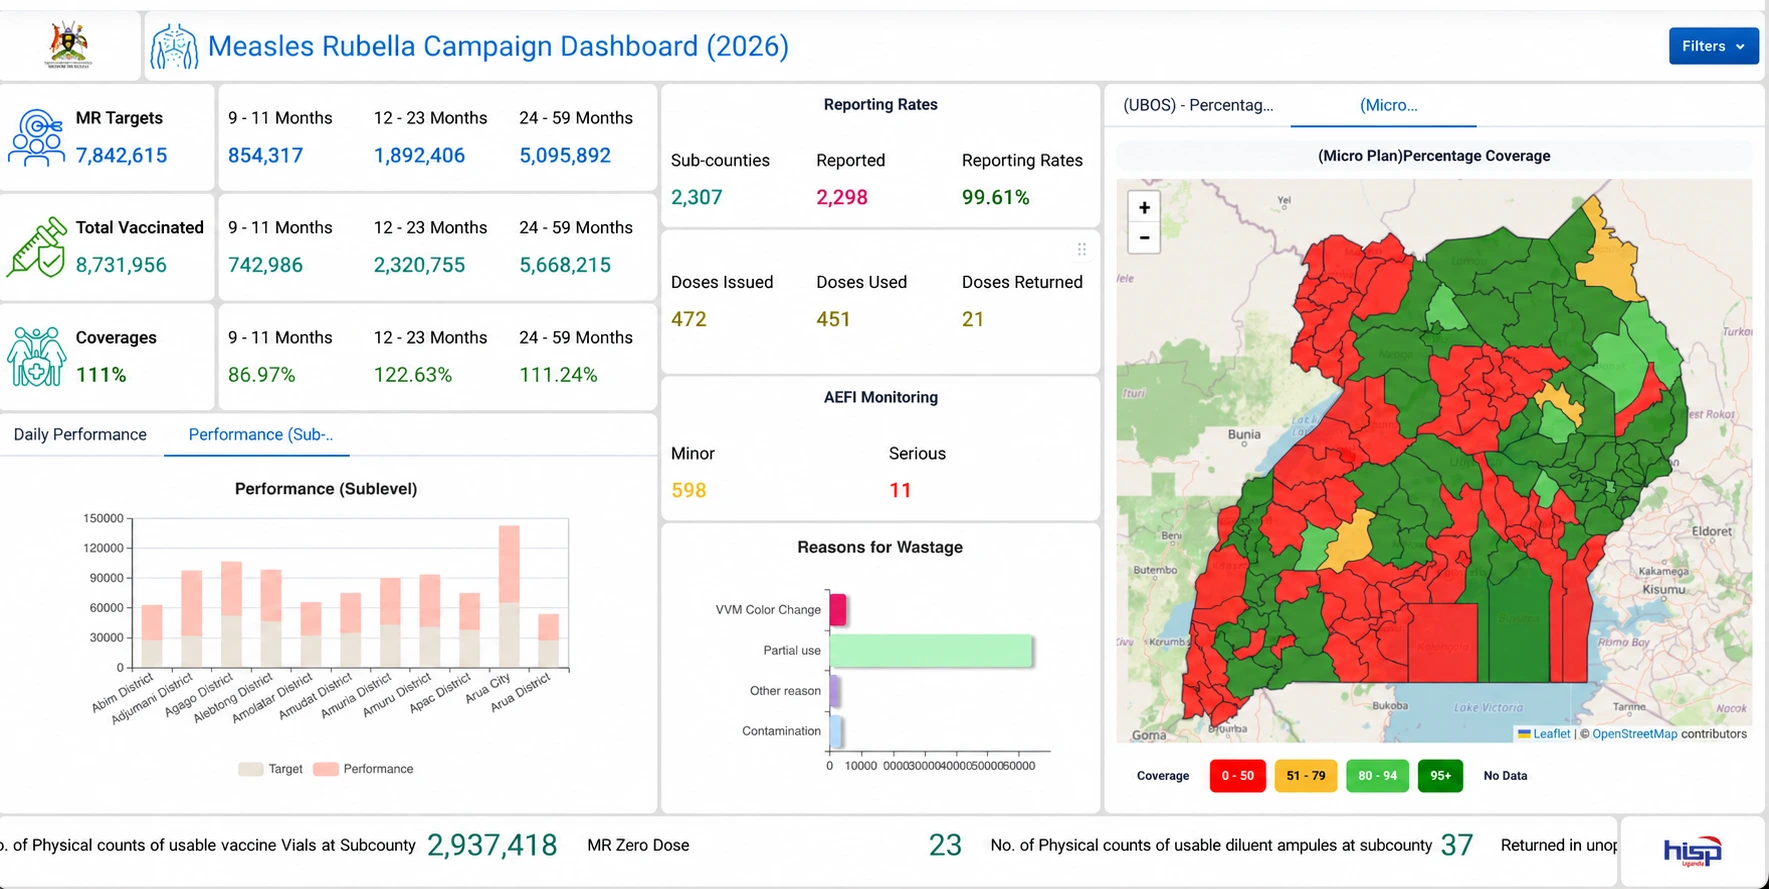
Campaign monitoring brings together vaccination targets, reported doses and geographic coverage. Teams need to compare these measures across age groups and locations while following reporting progress.
My contribution
I developed the Measles-Rubella campaign dashboard using DHIS2 Visualisation Studio, supporting nationwide monitoring across three implementation phases.
Inside the dashboard
- Targets, vaccinations and coverage broken down by age group.
- Reporting completeness and district-level performance comparisons.
- Geographic coverage maps alongside vaccine use, wastage and AEFI monitoring.
Delivered capability
The dashboard brings campaign indicators into a shared reporting view for national and subnational monitoring.
Explore related work