
Uganda · Public health
HPV vaccination & adolescent health
Connecting vaccination coverage, routine trends and school-health indicators in one reporting view.
100% dummy/test data — demonstration only. All figures in this screenshot are synthetic. They do not represent live reporting, actual programme results or real health and education statistics.
The context
What the dashboard brings together.
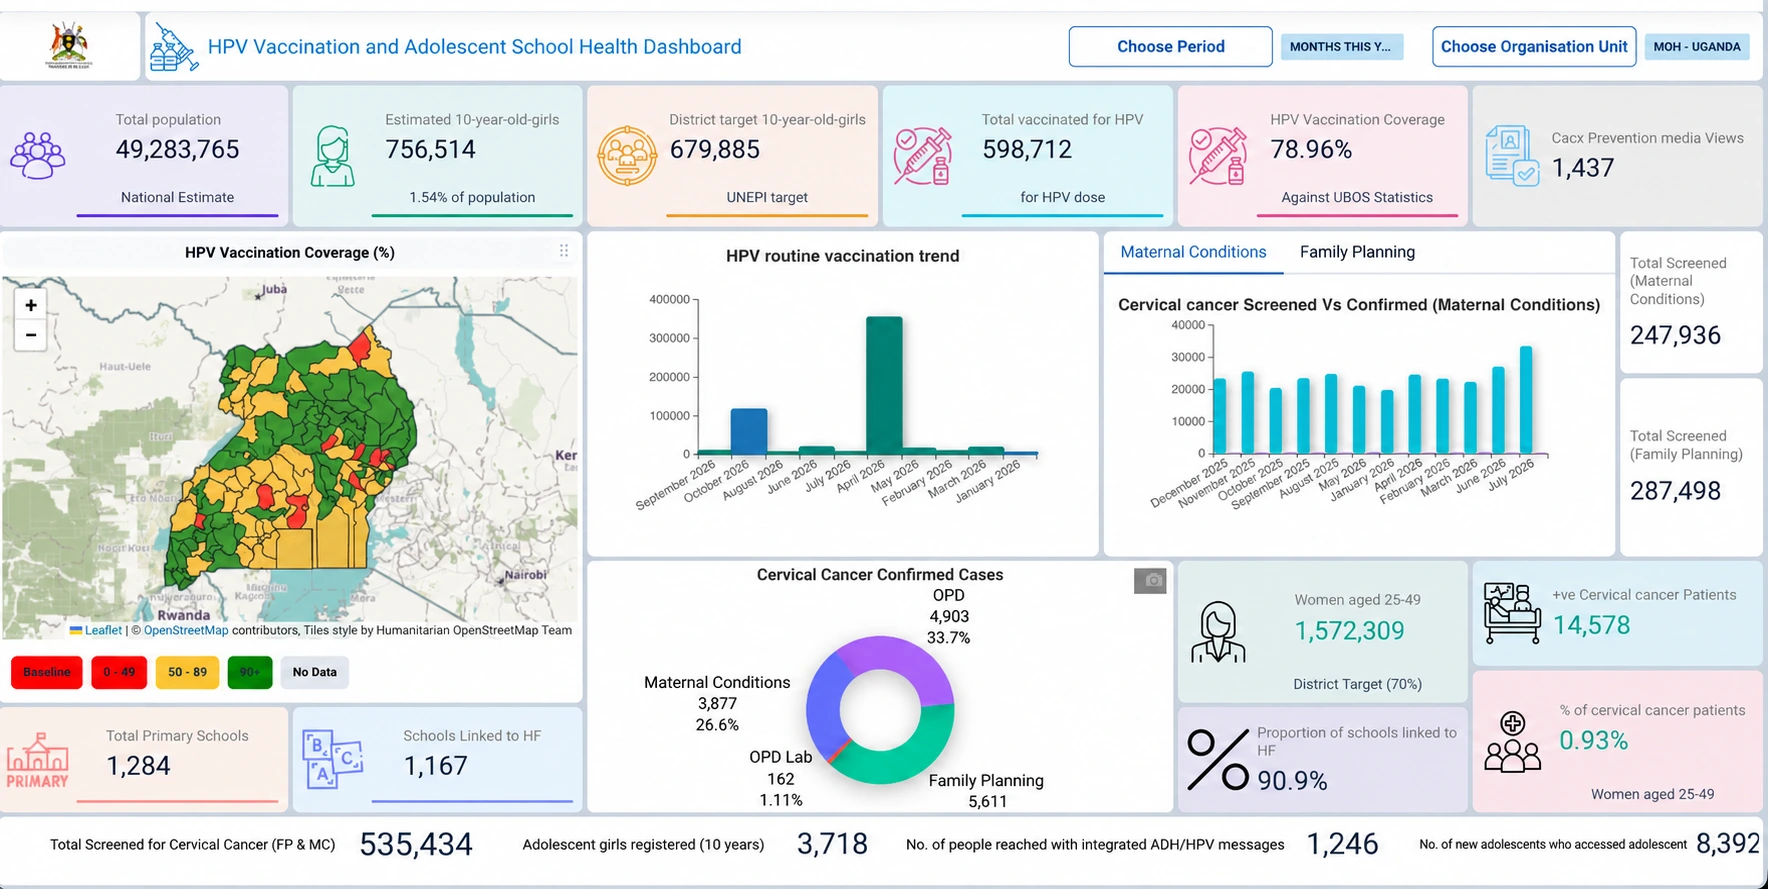
HPV monitoring spans population targets, registration, vaccination and links between schools and health facilities. Bringing these measures together helps teams follow the vaccination pathway.
My contribution
I delivered HPV dashboard work across two phases in six Ugandan districts, covering registration, vaccination, coverage, routine trends and school linkage.
Inside the dashboard
- Population targets, vaccinations and coverage indicators.
- A geographic coverage map and routine vaccination trends.
- School-health linkage and related adolescent and cervical cancer screening indicators.
Delivered capability
The dashboard connects vaccination monitoring with related school and health-service indicators. The demo screenshot illustrates its national overview configuration using entirely synthetic test data.
Explore related work